Appearance
Accessibility Scoring System
The Accessibility Scoring System is designed to quantify how well individual pages and entire sites meet accessibility requirements. It operates at two levels: page-level scoring and site-level scoring.
Page-Level Scoring
Scoring Methodology
The page accessibility score is calculated based on the violations detected by the axe-core scan.
The score represents the percentage of accessibility requirements that are met, with 100 being a perfect score (no violations).
The scoring system takes into account:
- The severity (impact) of each violation
- The number of elements affected by each violation
- The total number of elements that were tested
Severity Levels and Weights
Violations are categorized into four severity levels, each with an assigned weight:
| Severity Level | Weight | Description |
|---|---|---|
| Critical | 4.0 | Issues that completely prevent users with disabilities from using the feature |
| High | 1.0 | Issues that create significant barriers for users with disabilities |
| Medium | 0.1 | Issues that create moderate barriers for users with disabilities |
| Low | 0.0 | Issues that create minor inconveniences for users with disabilities |
These weights are used in the score calculation to give more importance to critical issues.
Score Calculation Formula
The accessibility score is calculated using the following formula:
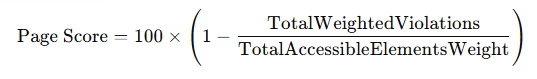
Where:
- TotalWeightedViolations: Sum of (violation severity weight × number of affected nodes) for all violations
- TotalAccessibleElementsWeight: Sum of (severity weight × number of nodes) for all tested elements (both passing and failing)
If there are no violations, the score is automatically 100.
The final score is rounded to one decimal place.
Site-Level Scoring
Scoring Methodology
The site accessibility score aggregates the scores of individual scanned pages while considering page traffic (number of visits).
This ensures that frequently visited pages have a greater influence on the overall site score than rarely visited ones.
In other words:
- A page with high traffic and low accessibility will reduce the site score significantly.
- A page with low traffic and low accessibility will have a smaller impact.
- Perfectly accessible pages improve the overall score proportionally to their traffic.
Weighted Contribution
Each page contributes to the site score based on both its score and its number of visits:
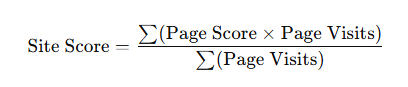
Where:
- Page Score = accessibility score of the page (from page-level scoring)
- Page Visits = number of times the page was visited in the measurement period
Example
- Page A → Score: 50, Visits: 10
- Page B → Score: 90, Visits: 5
Site Score = ((50 × 10) + (90 × 5)) / (10 + 5) = (500 + 450) / 15 = 63.3In this case, Page A’s low score strongly drags down the site score because it is visited more frequently.